Veteran Movers NYC LLC

17 Dobbin Street

DOT 1854436

Company Image
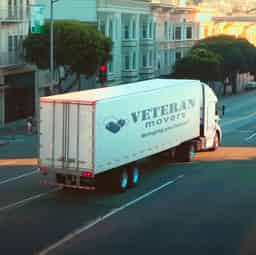
Veteran Movers NYC is a one-of-a-kind moving company that was started only 12 years ago. Led by Jesse Gartman, a former US Marine, to help other veterans and offer honest moving services in NYC. Their team handles local, long-distance, and commercial moves, plus packing and storage. Great service for low prices? Sounds like a no-brainer! These guys are reliable, have the latest equipment, and fully stocked trucks! Their promise of "Never a customer left behind" comes from the military motto "No soldier left behind." Why choose them? They can move anything, anywhere, at any time. And their goal is to grow every day by focusing on being professional and making sure customers are happy.

Office location

17 Dobbin Street

Company avatar

FMCSA Company Profile

Years in Business: 16 years - First Registered in Feb. 2009

Last Report Filed with FMCSA: Less than 1 year ago

Company Information

Legal Name

roadway movers inc

DBA Name

roadway moving

DOT Number

1854436

Entity Type

Carrier

Company Officers

Officer 1

ross sapir

Cargo Types

Household Goods

Safety Information

Detailed safety guidelines and procedures to ensure compliance and minimize risks.

Violations

Total
Severe (Out of Service)
Driver Unfit to Drive
Unsafe Driving
Tired Driver
Vehicle Not Well Maintained

Violations explained

These are all the recorded violations for Veteran Movers NYC LLC
Total: All recorded violations.
Severe (Out of Service): Critical violations halting operations until fixed. (The truck or the driver cannot drive and it would be illegal for them to do so.)
Driver Unfit to Drive: Violations regarding driver qualifications (medical, CDL, documents). For example, they are supposed to wear eyeglasses but are found driving without them.
Unsafe Driving: Violations like speeding, improper lane changes, ignoring traffic signs.
Tired Driver: Violations of driving/rest period rules preventing fatigue.
Vehicle Not Well Maintained: Vehicle-related violations (brakes, lights, cargo security, mechanical).
The risk score evaluates each carrier's safety performance, combining key factors to provide a comprehensive safety assessment.
Purpose of the Risk Score: The score identifies carriers with higher safety risks by analyzing critical safety factors and providing actionable insights for improvement.
Factors Included in the Score: Combines unsafe driving, hours of service, driver fitness, substance use, and vehicle maintenance measures into a single metric.
Weight Distribution: Each factor is weighted based on its impact on safety, with unsafe driving and compliance having the highest influence.
Data Sources: Derived from regulatory records, inspection results, and carrier-reported data, ensuring a robust and accurate evaluation.
Use of the Risk Score: Helps stakeholders identify high-risk carriers, prioritize interventions, and promote safer practices across the transportation industry.

Monthly Risk Score

5 measures combined monthly score

Crash Rate

0

Based on recordable crashes per vehicle

100% Lower

than national average.

Key Metrics

High-level performance indicators to quickly assess the company's scale and activity.

Annual Miles (2023)

3,000,000

Filled: 29/10/2024

Driver Statistics

Total drivers registered with the FMCSA.

96

Total Drivers

96

CDL

Fleet Size:
Q
- 101-200

101

Total Trucks

Drivers

Overview of vehicle assets and their allocation for operational needs.

Driver Distribution

Overview of driver allocation for out-of-state and in-state routes, helping identify resource distribution.

Out-of-State

96

Distance Breakdown

Analysis of trip distances by in-state vs. out-of-state and local vs. long-distance operations.

Local (< 100 mi)Long-Distance (> 100 mi)
In-State––
Out-of-State6828

Inspections

This is a list of FMCSA inspections from highway stops, conducted either randomly by highway patrol or at weigh stations.

REPORT #
STATE
DATE↓
DRIVER VIOLATIONS
VEHICLE VIOLATIONS
UNSAFE DRIVING VIOLATIONS
DRIVER FATIGUE VIOLATIONS
SUBSTANCES OR ALCOHOL VIOLATIONS
VEHICLE MAINT. VIOLATIONS
2516000276MD2024-11-23000000
9328024453NV2024-11-15100401
SPL3040201NY2024-11-14010001
UDO8003705CA2024-11-10100102
7490000270AR2024-11-02000002
M602100088NY2024-10-30000000
3233001450MD2024-10-20000000
2516000183MD2024-10-19000000
Showing 1 of 45

Inspections per year

Inspections per 100K miles (2023)

12

Total Inspections

353

Safety Inspection Results

Failed Safety Inspections

3

33% Higher

than national average.

Driver-Related Safety Failures

2

20% Higher

than national average.

Vehicle-Related Safety Failures

1

9% Higher

than national average.

Inspections
The blue states indicate where this company was stopped for inspections in the past 4 years.

Violations

This is a list of violations that occurred during FMCSA inspections.

Insp DateCategorySevere FailureViolation Details
Showing 1 of 10

Violations per 100K miles

3

roadway moving

Total Violations

100

700% Higher

than national average.

Crashes

REPORT #
DATE↓
STATE
FATALITIES
INJURIES
TOW AWAY
LICENSE NUMBER
GA000785543001-NOV-20GA00Y2425279
NY401336290013-DEC-23NY01Y5245999
CA265240033830-JAN-24CA00Y60895R3
NY398547610031-MAY-23NY02Y99374MM

Amount of Crashes

4

Injury Crashes
2

Fatalities

0

Injuries

3

Injury Rate:
1.00

Number of Tows

4

Tow Rate:
100.0%

Number of fatalities per year
Number of injuries per year

Incidents by season

Incidents by weather condition

Incidents by road surface condition

Incidents by light condition

Crash Map
Visualization of crashes data across the United States.