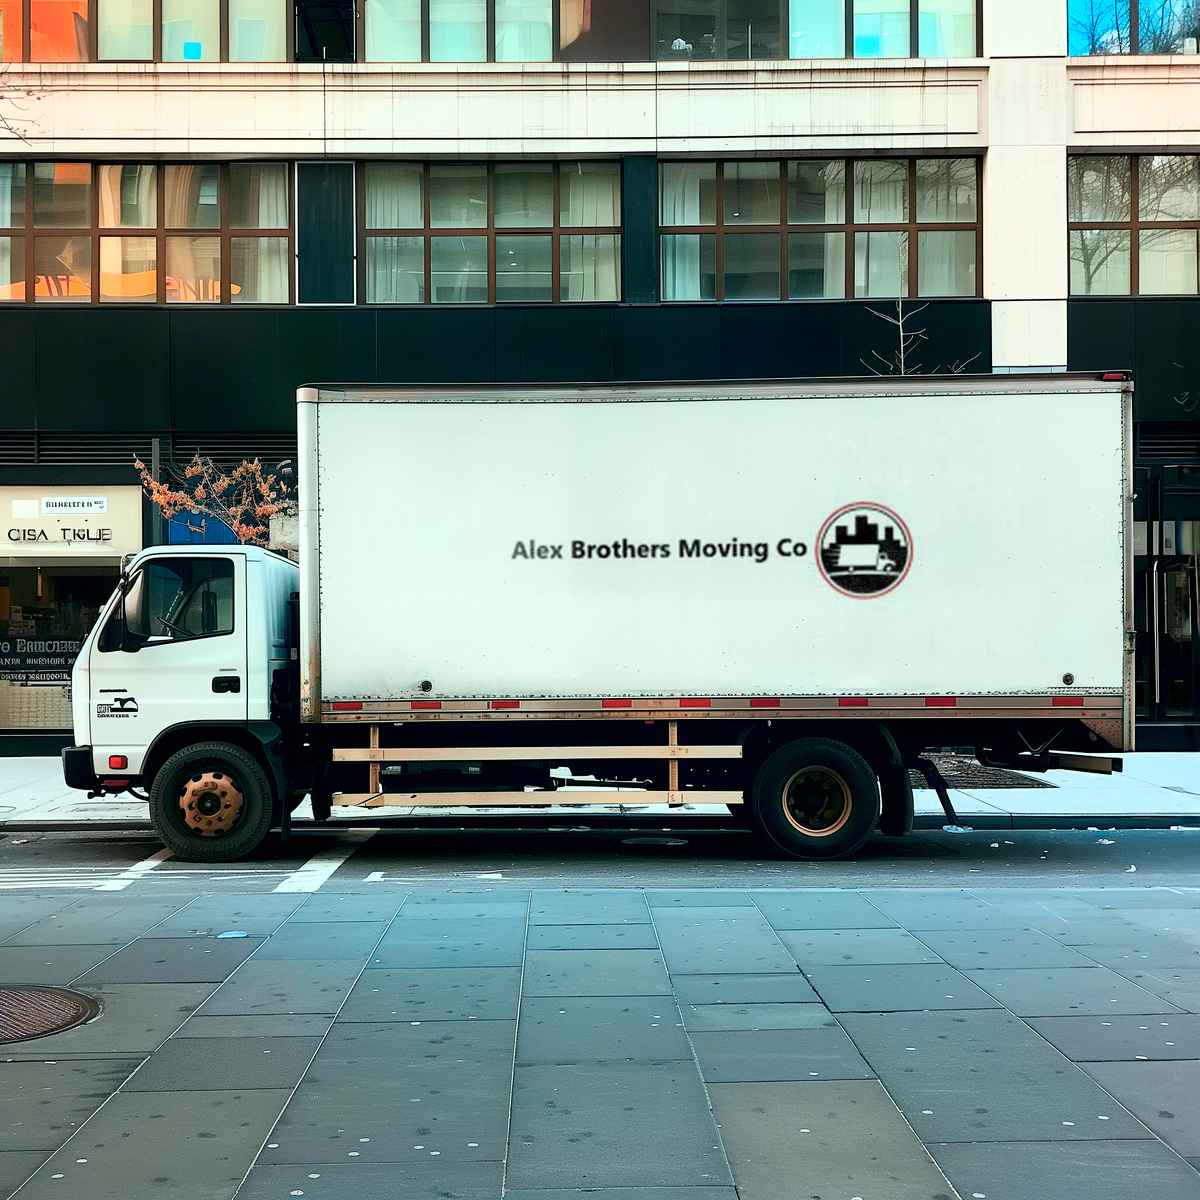
Alex Brothers Moving Co

1698 S Oakland St Aurora, Co 80012, USA

DOT 3546001

Alex Brothers Moving is a family-owned and fully licensed moving service based in Aurora, CO. If you're after a team that will do everything in its power to make sure your move goes smoothly, you can stop searching. This crew is all about taking the headache out of the moving equation, making your moving day feel like a walk in the park. No matter if you're moving your home or office, these guys will handle everything so carefully and professionally you won't even realize you're moving! They can help with packing, loading, furniture assembly, storage, local and even long-distance moves! Alex Brothers Moving treats each customer's things as their own, making sure every item is moved safely and efficiently. They aim to provide the best moving experiences in Aurora, CA, always arriving promptly and facing every challenge with eagerness. This team has managed to earn their community's trust and is constantly recommended by each client who's moved with them. If you're looking for a killer team to turn your move into an unforgettable experience, call Alex Brothers. They'll have you moved in no time and for a super affordable price! Ask for a quote.
Company Image
Company avatar

FMCSA Company Profile

Years in Business: 4 years (First Registered in Jan. 2021)

Last Report Filed with FMCSA: Less than 1 year ago ago

Company Information

Legal Name
alex brothers moving company llc
DOT Number
3546001
Entity Type
Carrier

Company Officers

Officer 1
vicente leon guevara

Cargo Types

Household Goods

Safety Information

Detailed safety guidelines and procedures to ensure compliance and minimize risks.

Violations

Below are all recorded violations for Alex Brothers Moving Co

Types of Violations:
Total
Severe (Out of Service)
Driver Unfit to Drive
Unsafe Driving
Tired Driver
Vehicle Not Well Maintained
Violations Explained
These are all the recorded violations for Alex Brothers Moving Co
Total: All recorded violations.
Severe (Out of Service): Critical violations halting operations until fixed. (The truck or the driver cannot drive and it would be illegal for them to do so.)
Driver Unfit to Drive: Violations regarding driver qualifications (medical, CDL, documents). For example, they are supposed to wear eyeglasses but are found driving without them.
Unsafe Driving: Violations like speeding, improper lane changes, ignoring traffic signs.
Tired Driver: Violations of driving/rest period rules preventing fatigue.
Vehicle Not Well Maintained: Vehicle-related violations (brakes, lights, cargo security, mechanical).

Crash Rate

0

Based on recordable crashes per vehicle

100% Lower

than national average.

Key Metrics

High-level performance indicators to quickly assess the company's scale and activity.

Annual Miles (2023)

60,000

Filled: 30/09/2024

Driver Statistics

Total drivers registered with the FMCSA.

2

Total Drivers

0

CDL

Fleet Size:
B
- 2-3

2

Fleet Size

2

Power Units

Drivers

Overview of vehicle assets and their allocation for operational needs.

Driver Distribution

Overview of driver allocation for interstate and intrastate routes, helping identify resource distribution.

Cross-State:
2

Distance Breakdown

Analysis of trip distances categorized by interstate (cross-State) and intrastate (in-State) operations to optimize planning.

Inspections

This is a list of FMCSA inspections from highway stops, conducted either randomly by highway patrol or at weigh stations.

REPORT #
STATE
DATE↓
DRIVER VIOLATIONS
VEHICLE VIOLATIONS
UNSAFE DRIVING VIOLATIONS
DRIVER FATIGUE VIOLATIONS
SUBSTANCES OR ALCOHOL VIOLATIONS
VEHICLE MAINT. VIOLATIONS
1025011604MS2024-06-12000000
G706155188OK2024-06-04000000
4000O37FTRNM2024-04-24000000
4390O1NFJGNM2024-02-28000000
PF25202284CO2023-11-15000000
I204153511OK2022-02-28000001
2667L8DGJCNM2021-10-28001000
2667L75FMHNM2021-09-14101100
Showing 1 of 2

Inspections per year

Inspections per 100K miles (2023)

15

Total Inspections

9

Safety Inspection Results

Failed Safety Inspections

1

8% Higher

than national average.

Driver-Related Safety Failures

1

7% Higher

than national average.

Vehicle-Related Safety Failures

0

4% Lower

than national average.

Inspections
The blue states indicate where this company was stopped for inspections in the past 4 years.

Violations

This is a list of violations that occurred during FMCSA inspections.

Insp DateCategorySevere FailureViolation Details
Showing 1 of 2

Violations per 100K miles

25

100% Lower

than national average.

Total Violations

15

20% Higher

than national average.

Crashes

REPORT #
DATE↓
STATE
FATALITIES
INJURIES
TOW AWAY
LICENSE NUMBER
TX6XREHQE1ZZ04-AUG-24TX00Y5857U92

Amount of Crashes

1

Fatalities

0

Injuries

0

Number of Tows

1

Tow Rate:
100.0%

Number of fatalities per year
Number of injuries per year

Incidents by season

Incidents by weather condition

Incidents by road surface condition

Incidents by light condition

Crash Map
Visualization of crashes data across the United States.