Annual Miles (2023)
8,000
1116 Shields Pl, Baltimore, MD 21201. Founded 3 years ago by darren lewis
Fleet
2
trucks
Experience
3
years
Average Rate
0.0(0 reviews)
Be the first to share your experience!
All data is sourced from the Federal Motor Carrier Safety Administration (FMCSA).
Company Profile
Years in Business: 3 years•First Registered in Oct 2022
Company Information
Legal Name
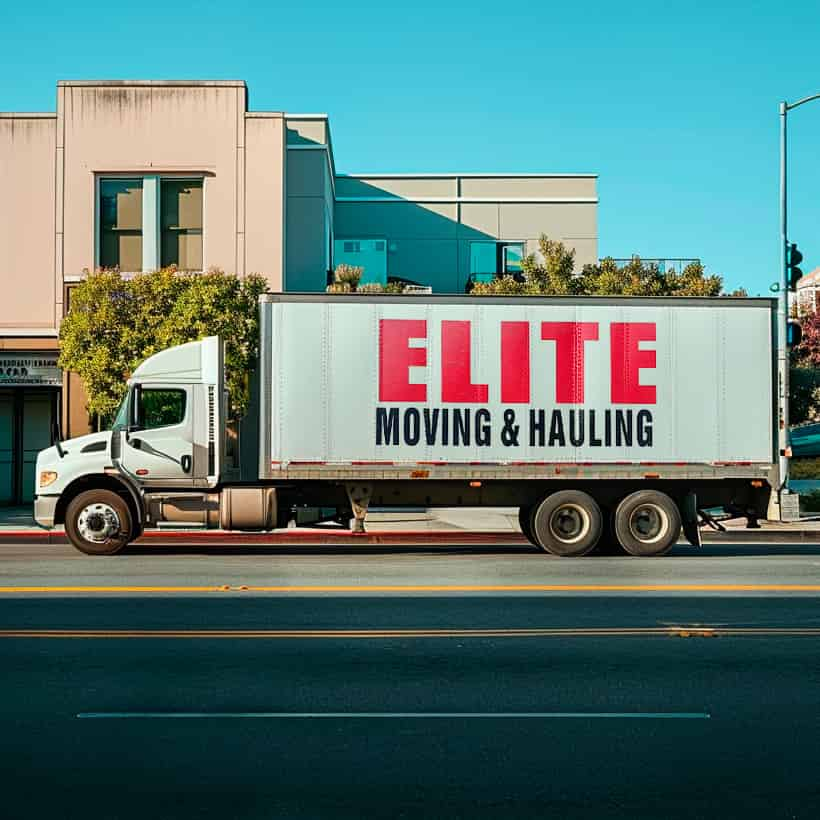
elite moving & hauling
DOT Number
3972294
Registration Date
2022-19-10
Entity Type
C
Filing Information
Last Government Update
2024-01-07
Cargo Types
Company Officer
Company Officer
darren lewis
High-level performance indicators to quickly assess the company's scale and activity.
8,000
2
Total Drivers
0
CDL Drivers
2
Total Trucks
Detailed safety guidelines and procedures to ensure compliance and minimize risks.
6
Total Inspections
1
Clean Inspections
16.7%
Inspection Pass Rate
Safety Analysis
Elite Moving and Hauling operates a fleet of 2 trucks and 2 drivers, logging over 8,000 miles in 2023.
16.7%Poor
Clean Inspection Rate
6
Total Inspections
1
Passed Clean
5
With Notes
Recent Inspections
!
2024-11-22
MD
Minor notes
!
2024-05-30
MD
Minor notes
2024-04-29
MD
Clean
!
2024-04-04
MD
Minor notes
Data sourced from FMCSA government records
Post your job opening and connect with qualified candidates.
Verified
Fast matching
2,500+ companies
Business Name | Years Running | Owner's Name | DOT # | Trucks ↓ | Drivers | Miles/Year | Address |
|---|---|---|---|---|---|---|---|
10 | james coleman | 2897746DOT Record | 143 | 143 | 1684131 | 100 eagle ridge dr, midland city, al 36350 | |
rukert terminals corporation | 52 | john l coulter | 6922 | 36 | 28 | 858502 | 2021 south clinton street, baltimore, md 21224 |
whiting & turner contracting co | 34 | tim wolfe | 472200 | 24 | 20 | 737989 | 5501 belle grove road, baltimore, md 21225 |
the salvation army | 23 | 1121200 | 24 | 23 | 0 | 2700 w patapsco ave, baltimore, md 21230 | |
picorp inc baltimore | 35 | amber gayhardt | 432913 | 21 | 26 | 505000 | 6508 east lombard street, baltimore, md 21224 |
jag transport inc | 21 | william childers jr | 1381861 | 20 | 20 | 190000 | 1700 s newkirk st, baltimore, md 21224 |
a & l foods inc | 37 | andrew d. lansman | 333143 | 16 | 15 | 395000 | 4200 amos ave, baltimore, md 21215 |
sterling moving and storage inc | 16 | joe magee | 2006832 | 16 | 8 | 0 | 8441 dorsey run road, jessup, md 20794 |