Annual Miles (2023)
50,000
4582 Mountain Lakes Blvd, Redding, CA 96003. Founded 19 years ago by mark risk
Mon-Fri: 09:00-16:00
Sat: 09:00-15:00
Fleet
3
trucks
Experience
19
years
Average Rate
0.0(0 reviews)
Be the first to share your experience!
All data is sourced from the Federal Motor Carrier Safety Administration (FMCSA).
Company Profile
Years in Business: 19 years•First Registered in Apr 2007
Company Information
Legal Name
hansens moving inc
DBA Name
hansens moving and storage
DOT Number
1630507
Registration Date
2007-10-04
Entity Type
C
Filing Information
Last Government Update
2024-12-06
Cargo Types
Company Officer
Company Officer
mark risk
High-level performance indicators to quickly assess the company's scale and activity.
50,000
3
Total Drivers
2
CDL Drivers
3
Total Trucks
Detailed safety guidelines and procedures to ensure compliance and minimize risks.
26
Total Inspections
24
Clean Inspections
92.3%
Inspection Pass Rate
Safety Analysis
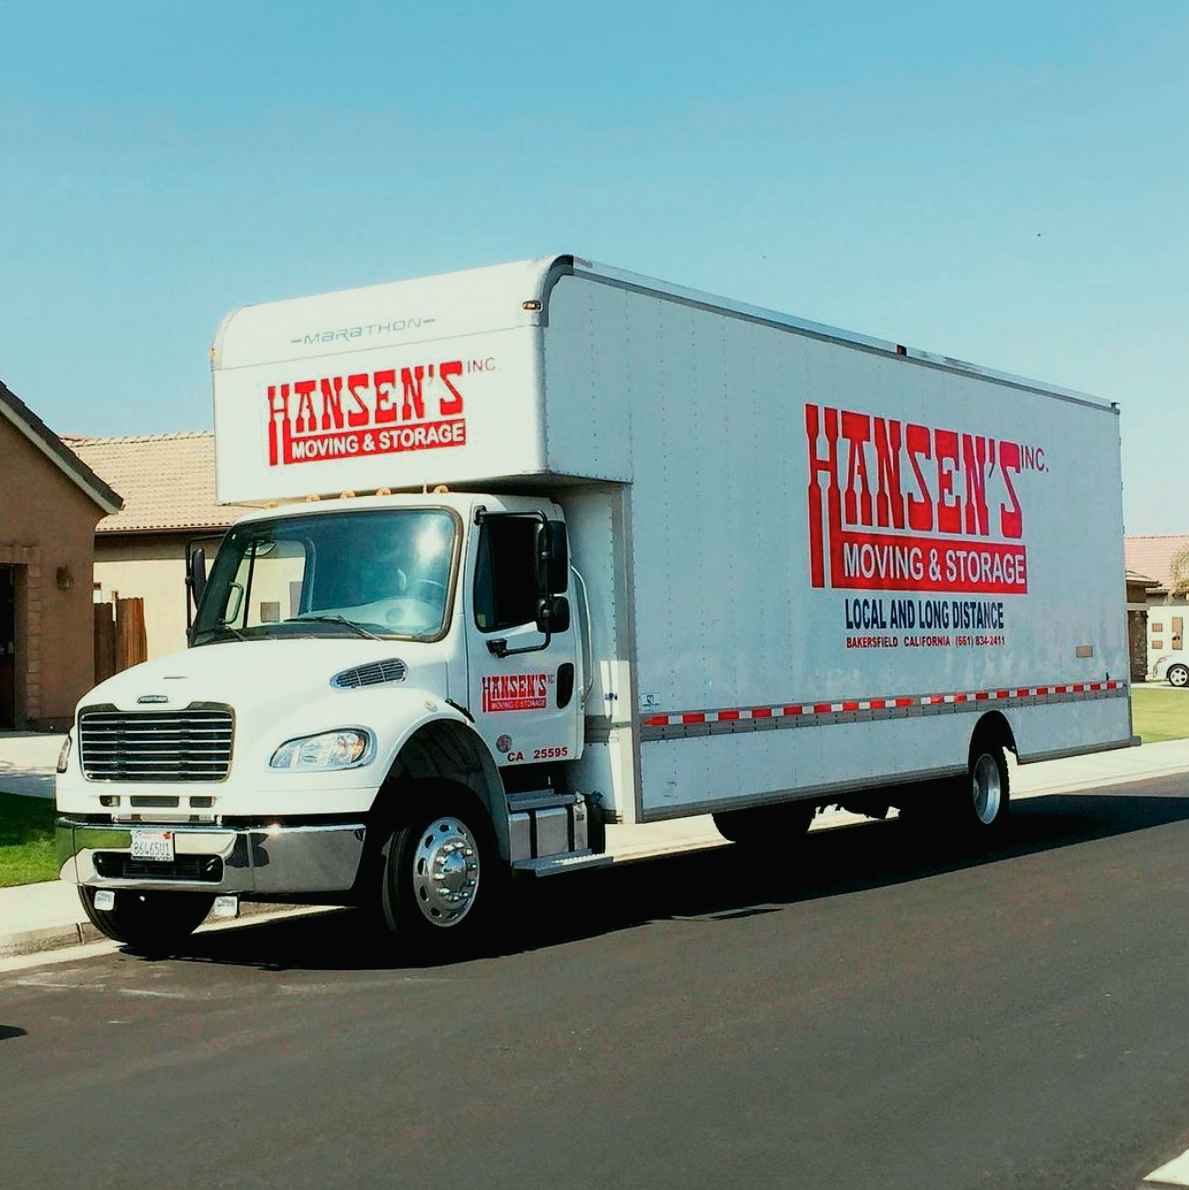
Hansen’s Moving and Storage operates a fleet of 3 trucks and 3 drivers, logging over 50,000 miles in 2023.
92.3%Excellent
Clean Inspection Rate
26
Total Inspections
24
Passed Clean
2
With Notes
Recent Inspections
2025-11-18
CA
Clean
2025-07-31
CA
Clean
2025-07-10
PA
Clean
2025-06-10
UT
Clean
Data sourced from FMCSA government records
Post your job opening and connect with qualified candidates.
Verified
Fast matching
2,500+ companies
Business Name | Years Running | Owner's Name | DOT # | Trucks ↓ | Drivers | Miles/Year | Address |
|---|---|---|---|---|---|---|---|
california towing & transport inc | 12 | kevin f orepeza | 2508854 | 11 | 4 | 206432 | 9700 holton way, redding, ca 96003-9500 |
redding appliance center llc | 11 | mario antone calleagari | 2773706 | 7 | 9 | 200000 | 2330 churn creek rd, redding, ca 96002 |
redding professional movers inc | 19 | vance montgomery | 1615467 | 7 | 8 | 1000000 | 4777 caterpillar road, redding, ca 96003 |
22 | angie humphrey | 1256884DOT Record | 5 | 6 | 56238 | 31803 s wright rd, molalla, or 97038 | |
kuebler's furniture inc | 27 | alan kuebler | 767239 | 4 | 5 | 25000 | 1894 churn creek rd, redding, ca 96002 |
cb enterprise llc | 10 | matthew g cooper | 2853887 | 3 | 6 | 650000 | 8865 airport road ste r, redding, ca 96002 |
19 | mark risk | 1630507DOT Record | 3 | 3 | 50000 | 4582 mountain lakes blvd, redding, ca 96003 | |
roy alan king inc | 7 | daniel king | 3227060 | 2 | 1 | 10000 | 3609 bechelli lane suite i, redding, ca 96002 |