Annual Miles (2021)
220,000
12022 Blue Valley Pkwy PMB 526, Overland Park, KS 66213. Founded 14 years ago by derek shaw
DOT#2275038
Mon-Fri: 08:00-19:00
Sat: 09:00-17:00
Sun: 10:00-16:00
Fleet
11
trucks
Experience
14
years
Average Rate
0.0(0 reviews)
Be the first to share your experience!
All data is sourced from the Federal Motor Carrier Safety Administration (FMCSA).
Company Profile
Years in Business: 14 years•First Registered in Feb 2012
Company Information
Legal Name
moving proz llc
DBA Name
moving proz
DOT Number
2275038
Registration Date
2012-20-02
Entity Type
C
Filing Information
Last Government Update
2025-16-10
Cargo Types
Company Officer
Company Officer
derek shaw
High-level performance indicators to quickly assess the company's scale and activity.
220,000
24
Total Drivers
0
CDL Drivers
11
Total Trucks
Detailed safety guidelines and procedures to ensure compliance and minimize risks.
30
Total Inspections
21
Clean Inspections
70.0%
Inspection Pass Rate
Safety Analysis
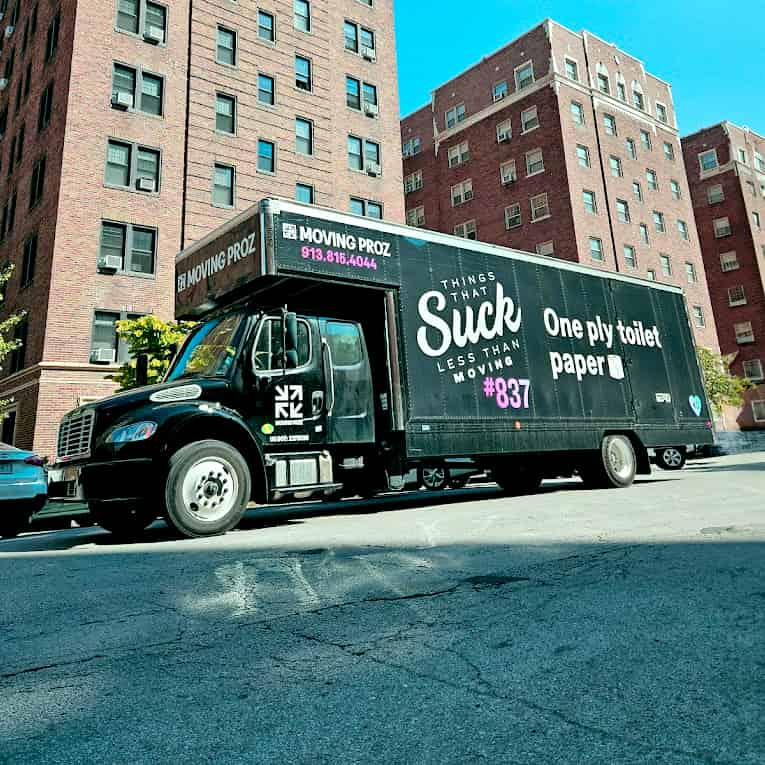
Moving Proz operates a fleet of 11 trucks and 24 drivers, logging over 220,000 miles in 2021.
70.0%Average
Clean Inspection Rate
30
Total Inspections
21
Passed Clean
9
With Notes
Recent Inspections
!
2025-10-16
KS
Minor notes
!
2024-12-18
WI
Minor notes
2024-11-04
IA
Clean
2024-04-27
KS
Clean
Data sourced from FMCSA government records
Post your job opening and connect with qualified candidates.
Verified
Fast matching
2,500+ companies
Business Name | Years Running | Owner's Name | DOT # | Trucks ↓ | Drivers | Miles/Year | Address |
|---|---|---|---|---|---|---|---|
new penn motor express llc | 52 | darrel harris | 10670 | 830 | 800 | 32328884 | 11500 outlook street suite 400, overland park, ks 66211 |
14 | derek shaw | 2275038DOT Record | 22 | 24 | 220000 | 1702 e 123rd terrace, olathe, ks 66061 | |
ladder heroes packing llc | 15 | justin henry | 2142793 | 8 | 9 | 130000 | 7967 frontage rd, overland park, ks 66204 |
pro-tow llc | 33 | joe richard | 498810 | 7 | 5 | 228635 | 3505 merriam dr, overland park, ks 66203 |
12 | brad carver | 2499247DOT Record | 4 | 3 | 16540 | 12419 w 154th ter, overland park, ks 66221 | |
12 | troy love | 2460847DOT Record | 4 | 3 | 5000 | 210 sw hampton st, topeka, ks 66612 | |
tony rumley | 11 | joe rumley | 2531086 | 2 | 2 | 8000 | 9393 w 110th street suite 500, overland park, ks 66210-1864 |
ist leasing incorporated | 14 | charan kaur | 2302778 | 2 | 2 | 184300 | 6301 west 158th street, overland park, ks 66223 |