Annual Miles (2024)
4,698,473
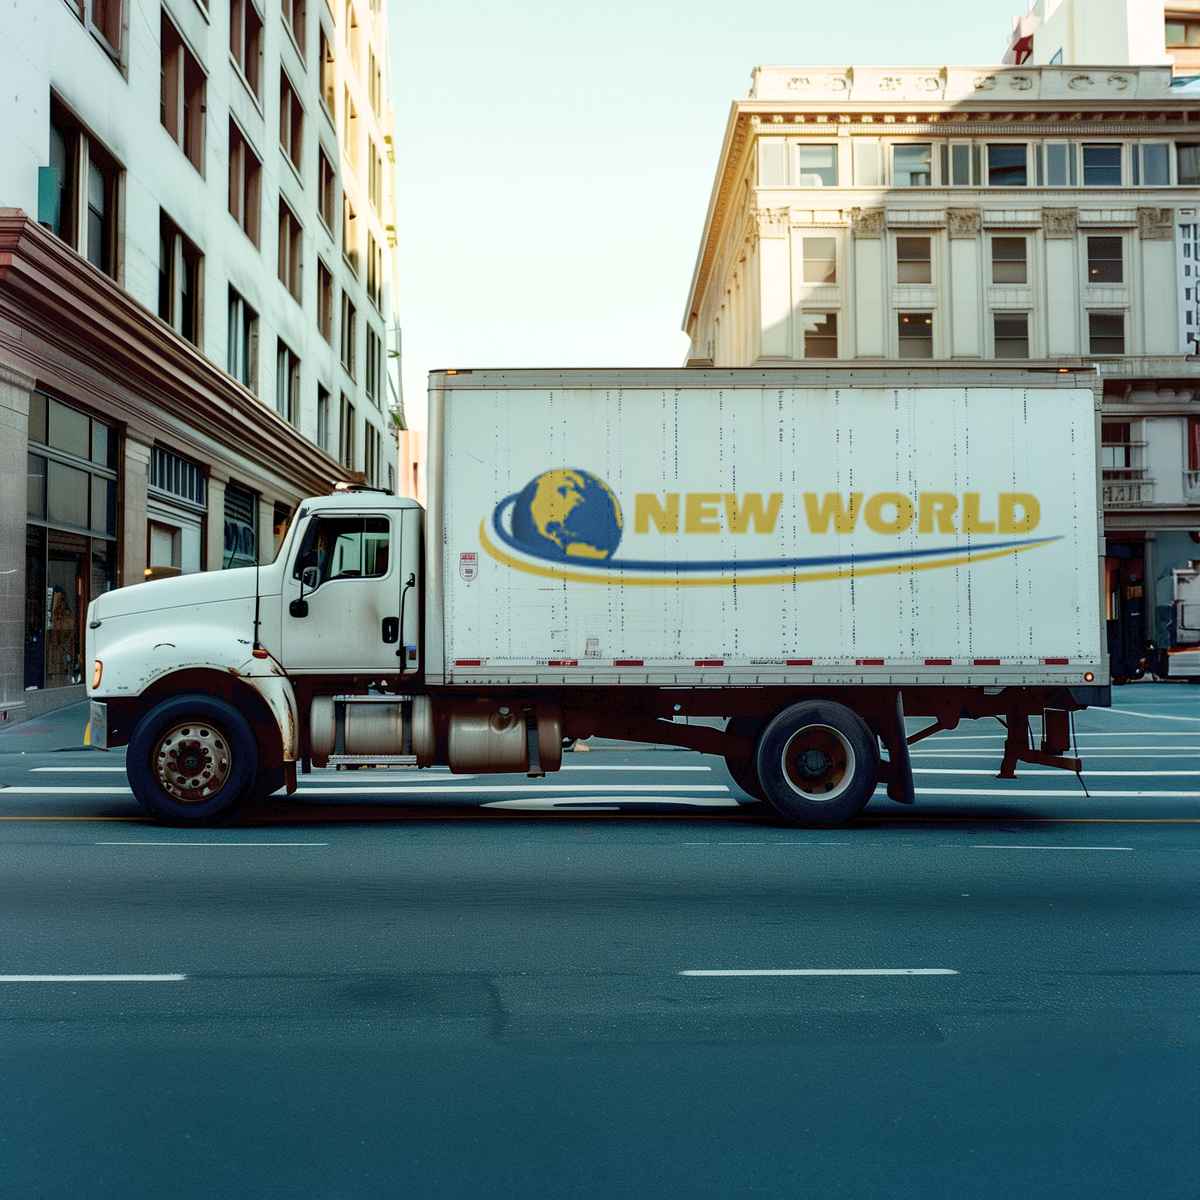
5875 N Rogers Ave, Chicago, IL 60646. Founded 41 years ago by rachelle pascente
Mon-Sat: 07:30-17:30
Fleet
204
trucks
Experience
41
years
Average Rate
0.0(0 reviews)
Be the first to share your experience!
All data is sourced from the Federal Motor Carrier Safety Administration (FMCSA).
Company Profile
Years in Business: 41 years•First Registered in Apr 1985
Company Information
Legal Name
new world van lines inc
DOT Number
258748
Registration Date
1985-30-04
Entity Type
C;B
Filing Information
Last Government Update
2025-24-11
Cargo Types
Company Officer
Company Officer
rachelle pascente
High-level performance indicators to quickly assess the company's scale and activity.
4,698,473
189
Total Drivers
189
CDL Drivers
204
Total Trucks
S Satisfactory
Latest Review: Feb 2004
Detailed safety guidelines and procedures to ensure compliance and minimize risks.
784
Total Inspections
692
Clean Inspections
88.3%
Inspection Pass Rate
Safety Analysis
New World Van Lines operates a fleet of 204 trucks and 189 drivers, logging over 4,698,473 miles in 2024.
FMCSA lists the company's safety rating as"Satisfactory," issued after a Jan 1970 compliance review, indicating federal inspectors found no critical deficiencies in safety management.
88.3%Good
Clean Inspection Rate
784
Total Inspections
692
Passed Clean
92
With Notes
Recent Inspections
2025-11-24
NC
Clean
2025-11-15
WA
Clean
2025-11-13
KS
Clean
!
2025-11-07
LA
Minor notes
Data sourced from FMCSA government records
Post your job opening and connect with qualified candidates.
Verified
Fast matching
2,500+ companies
Business Name | Years Running | Owner's Name | DOT # | Trucks ↓ | Drivers | Miles/Year | Address |
|---|---|---|---|---|---|---|---|
52 | mark davison | 76235DOT Record | 1038 | 1944 | 33260561 | 101 east washington blvd suite 1100, fort wayne, in 46802 | |
national van lines inc | 52 | timothy helenthal | 76628 | 234 | 177 | 3898919 | 2800 roosevelt road, broadview, il 60155 |
41 | rachelle pascente | 258748DOT Record | 218 | 218 | 5026742 | 5875 n rogers avenue, chicago, il 60646 | |
carmichael leasing co inc | 25 | maximilian bechina | 934642 | 150 | 13 | 4798626 | 2200 s loomis st #1, chicago, il 60608 |
ohio rail connection inc | 21 | nabeel razick | 1285063 | 83 | 83 | 2000000 | 4900 s mason, chicago, il 60638 |
j & j trucking enterprise inc | 21 | john kurpiel | 1276545 | 82 | 76 | 7798359 | 5950 w 51st st, chicago, il 60638 |
new city moving llc | 3 | randall branscome | 4020807 | 78 | 56 | 3850 | 2929 n campbell ave, chicago, il 60618 |
special service co inc | 52 | 143437 | 54 | 56 | 0 | 681 n green st, chicago, il 60622-5966 |