Verified Partner

M & M Movers

165 N. Maple Avenue P.O. Box 419 Manteca, CA 95336

DOT 2944961

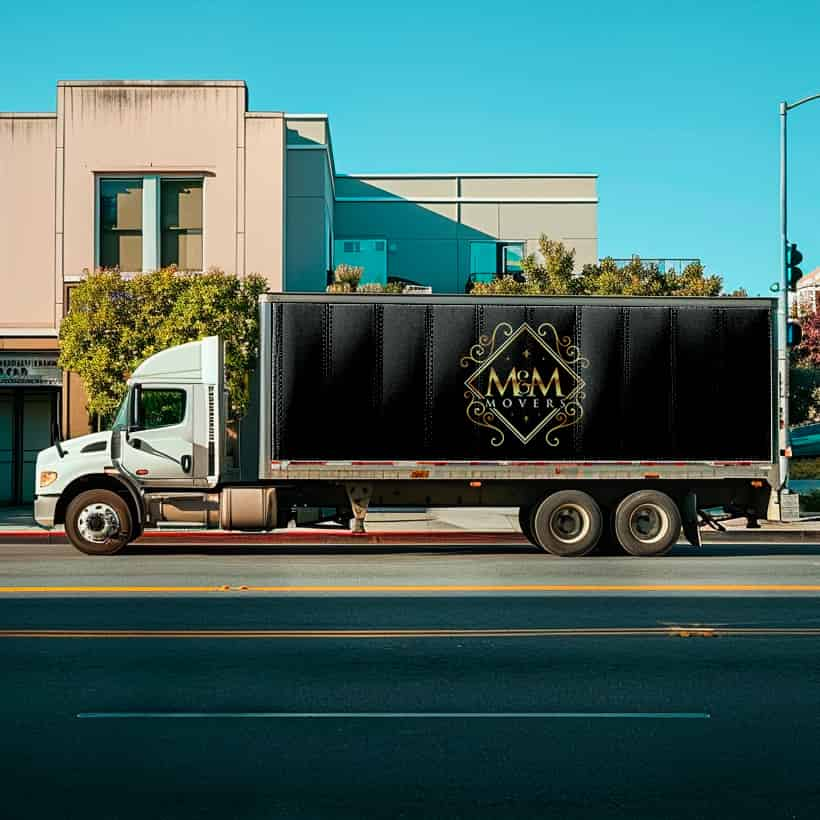
Company Image
JR Huizar worked in the moving industry for over twenty years when he decided to start his own business. It was December 2016. He took his family and began M&M Movers as a family-owned and operated business. Almost a decade later, the enterprise is still going strong. With a 4.8 on Yelp, a 4.9 on Google, and an "exceptional" qualification on Great Guys Moving, clients can't get enough of this team's service. Customers have used words like "friendly," "quick," "affordable," and "professional" to describe them. But what kind of services do they provide? M&M offers comprehensive moving solutions for individuals, families, and businesses. They'll plan accordingly to your specific needs. This crew can move a house, condo, apartment, senior citizens, pianos, gun safes, appliances, and more, locally or long-distance. JR can even round up members of his team to accommodate a sudden, same-day move. He has specialists who can pack everything safely or deliver the packing supplies to your door. His movers can also go on dump or donation runs and assemble and disassemble furniture. Call them if you can't see what you need on this list. They'll find a solution for you.
Company avatar

FMCSA Company Profile

Years in Business: 8 years - First Registered in Nov. 2016

Last Report Filed with FMCSA: Less than 1 year ago

Company Information

Legal Name

adan huizar jr

DBA Name

m & m movers

DOT Number

2944961

Entity Type

Carrier

Company Officers

Officer 1

adan huizar jr

Cargo Types

General Freight
Household Goods

Safety Information

Detailed safety guidelines and procedures to ensure compliance and minimize risks.

Violations

Total
Severe (Out of Service)
Driver Unfit to Drive
Unsafe Driving
Tired Driver
Vehicle Not Well Maintained

Violations explained

These are all the recorded violations for M & M Movers
Total: All recorded violations.
Severe (Out of Service): Critical violations halting operations until fixed. (The truck or the driver cannot drive and it would be illegal for them to do so.)
Driver Unfit to Drive: Violations regarding driver qualifications (medical, CDL, documents). For example, they are supposed to wear eyeglasses but are found driving without them.
Unsafe Driving: Violations like speeding, improper lane changes, ignoring traffic signs.
Tired Driver: Violations of driving/rest period rules preventing fatigue.
Vehicle Not Well Maintained: Vehicle-related violations (brakes, lights, cargo security, mechanical).

Crash Rate

1

Based on recordable crashes per vehicle

22122% Higher

than national average.

Key Metrics

High-level performance indicators to quickly assess the company's scale and activity.

Annual Miles (2023)

1

Filled: 27/11/2024

Driver Statistics

Total drivers registered with the FMCSA.

2

Total Drivers

0

CDL

Fleet Size:
A
- 1

1

Total Trucks

Drivers

Overview of vehicle assets and their allocation for operational needs.

Driver Distribution

Overview of driver allocation for out-of-state and in-state routes, helping identify resource distribution.

In-State

2

Distance Breakdown

Analysis of trip distances by in-state vs. out-of-state and local vs. long-distance operations.

Local (< 100 mi)Long-Distance (> 100 mi)
In-State–2
Out-of-State––

Inspections

This is a list of FMCSA inspections from highway stops, conducted either randomly by highway patrol or at weigh stations.

REPORT #
STATE
DATE↓
DRIVER VIOLATIONS
VEHICLE VIOLATIONS
UNSAFE DRIVING VIOLATIONS
DRIVER FATIGUE VIOLATIONS
SUBSTANCES OR ALCOHOL VIOLATIONS
VEHICLE MAINT. VIOLATIONS
UD2M002282CA2024-03-08000000
0264003384AZ2021-10-10111100
NBAU000799CA2021-06-24000000
NBAU000798CA2021-06-24000000
PF29501567CO2021-01-15200010
NA5N002375CA2020-10-29000000
NCTI001083CA2020-09-02000000
N5S0001941CA2020-06-01000000
Showing 1 of 2

Inspections per year

Inspections per 100K miles (2023)

1000000

Total Inspections

10

Safety Inspection Results

Failed Safety Inspections

2

20% Higher

than national average.

Driver-Related Safety Failures

2

20% Higher

than national average.

Vehicle-Related Safety Failures

1

9% Higher

than national average.

Inspections
The blue states indicate where this company was stopped for inspections in the past 4 years.

Violations

This is a list of violations that occurred during FMCSA inspections.

Insp DateCategorySevere FailureViolation Details
Showing 1 of 2

Violations per 100K miles

1,400,000

m & m movers

Total Violations

14

12% Higher

than national average.

Crashes

REPORT #
DATE↓
STATE
FATALITIES
INJURIES
TOW AWAY
LICENSE NUMBER
TX6F4GHQE1WJ01-OCT-22TX01Y05004D2

Amount of Crashes

1

Injury Crashes
1

Fatalities

0

Injuries

1

Injury Rate:
1000000.00

Number of Tows

1

Tow Rate:
100.0%

Number of fatalities per year
Number of injuries per year

Incidents by season

Incidents by weather condition

Incidents by road surface condition

Incidents by light condition

Crash Map
Visualization of crashes data across the United States.