Annual Miles (2024)
157,530
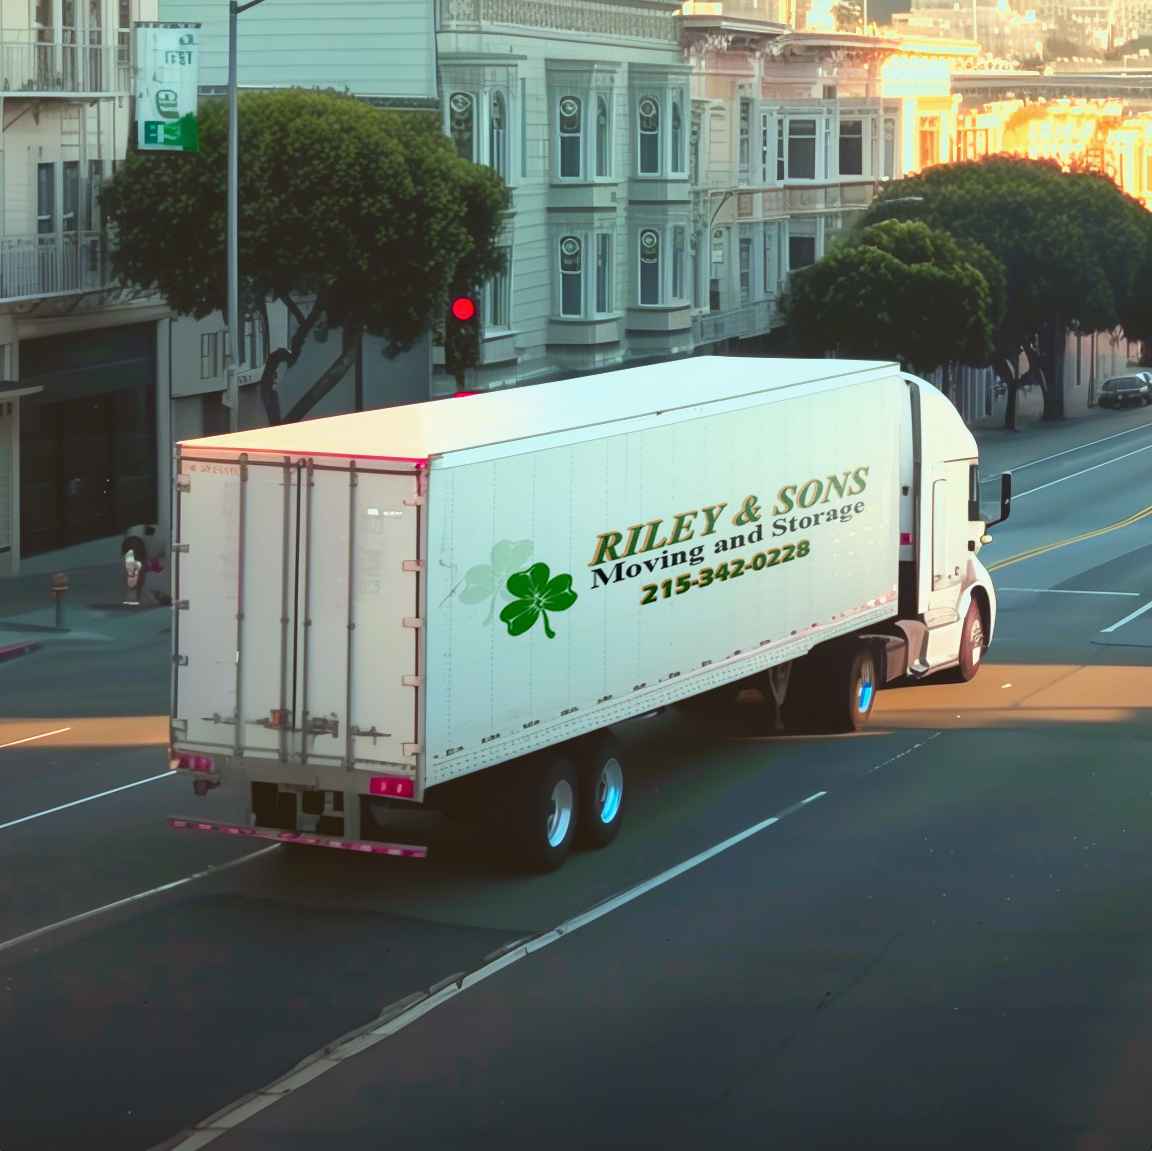
9800 Ashton Rd, Philadelphia, PA 19114. Founded 52 years ago by kevin m riley
Mon-Fri: 07:00-16:00
Fleet
15
trucks
Experience
52
years
Riley and Sons Moving stands out as Philadelphia's premier family-owned relocation company, operating since 1972 when Joseph P. Riley first established the business. Today, his sons Kevin and Tom continue the legacy, bringing decades of expertise to every move. What sets them apart from competitors is their comprehensive approach - they handle everything from local residential moves to complex commercial relocations across the entire East Coast, with particular specialization in Florida moves. Their Northeast Philadelphia facility provides secure storage solutions, while their trained crews offer professional packing services and careful handling of specialty items like pianos. As registered "Pro Movers" with both the Pennsylvania Moving and Storage Association and American Moving and Storage Association, they maintain the highest industry standards. Their commitment shows in consistently beating estimated timeframes while staying within budget, earning them recognition as top-rated movers who combine small-business personal attention with the capabilities to handle moves of any size throughout the region.
Average Rate
0.0(0 reviews)
Be the first to share your experience!
All data is sourced from the Federal Motor Carrier Safety Administration (FMCSA).
Company Profile
Years in Business: 52 years•First Registered in Jun 1974
Company Information
Legal Name
joseph p riley and sons moving company inc
DBA Name
riley and sons moving & storage
DOT Number
85429
Registration Date
1974-01-06
Entity Type
C
Filing Information
Last Government Update
2025-22-11
Cargo Types
Company Officer
Company Officer
kevin m riley
High-level performance indicators to quickly assess the company's scale and activity.
157,530
6
Total Drivers
2
CDL Drivers
15
Total Trucks
Detailed safety guidelines and procedures to ensure compliance and minimize risks.
38
Total Inspections
32
Clean Inspections
84.2%
Inspection Pass Rate
Safety Analysis
Riley and Sons Moving operates a fleet of 15 trucks and 6 drivers, logging over 157,530 miles in 2024.
84.2%Good
Clean Inspection Rate
38
Total Inspections
32
Passed Clean
6
With Notes
Recent Inspections
!
2025-08-04
SC
Minor notes
2025-08-01
DE
Clean
2025-05-06
MD
Clean
2024-11-22
NC
Clean
Data sourced from FMCSA government records
Post your job opening and connect with qualified candidates.
Verified
Fast matching
2,500+ companies
Business Name | Years Running | Owner's Name | DOT # | Trucks ↓ | Drivers | Miles/Year | Address |
|---|---|---|---|---|---|---|---|
napa transportation inc | 35 | ronald accomando | 446997 | 389 | 365 | 35562000 | 4800 east trindle road, mechanicsburg, pa 17055-0959 |
36 | laurence o'toole | 373544DOT Record | 88 | 253 | 5000000 | 7 mckay ave, winchester, ma 1890 | |
edo's trucking inc | 21 | jasna ljuca | 1327266 | 52 | 45 | 4802994 | 12 long lane, mechanicsburg, pa 17050 |
a c k deliveries llc | 5 | kwame ruffin | 3522997 | 20 | 20 | 0 | 5451 pentridge st, philadelphia, pa 19143-4125 |
remarkable solutions inc | 7 | avi turgeman | 3208047 | 20 | 1 | 180000 | 1701 s 25th st, philadelphia, pa 19145 |
towaway express inc | 40 | thomas s sheaffer | 265753 | 20 | 20 | 1803842 | 18 brenneman circle, mechanicsburg, pa 17050 |
16 | samuel michael shovel | 1989213DOT Record | 20 | 20 | 23000 | 1804 trinity valley drive, carrolton, tx 75006 | |
52 | kevin m riley | 85429DOT Record | 17 | 9 | 192760 | 9800 ashton rd, philadelphia, pa 19114 |