Annual Miles (2024)
200,000
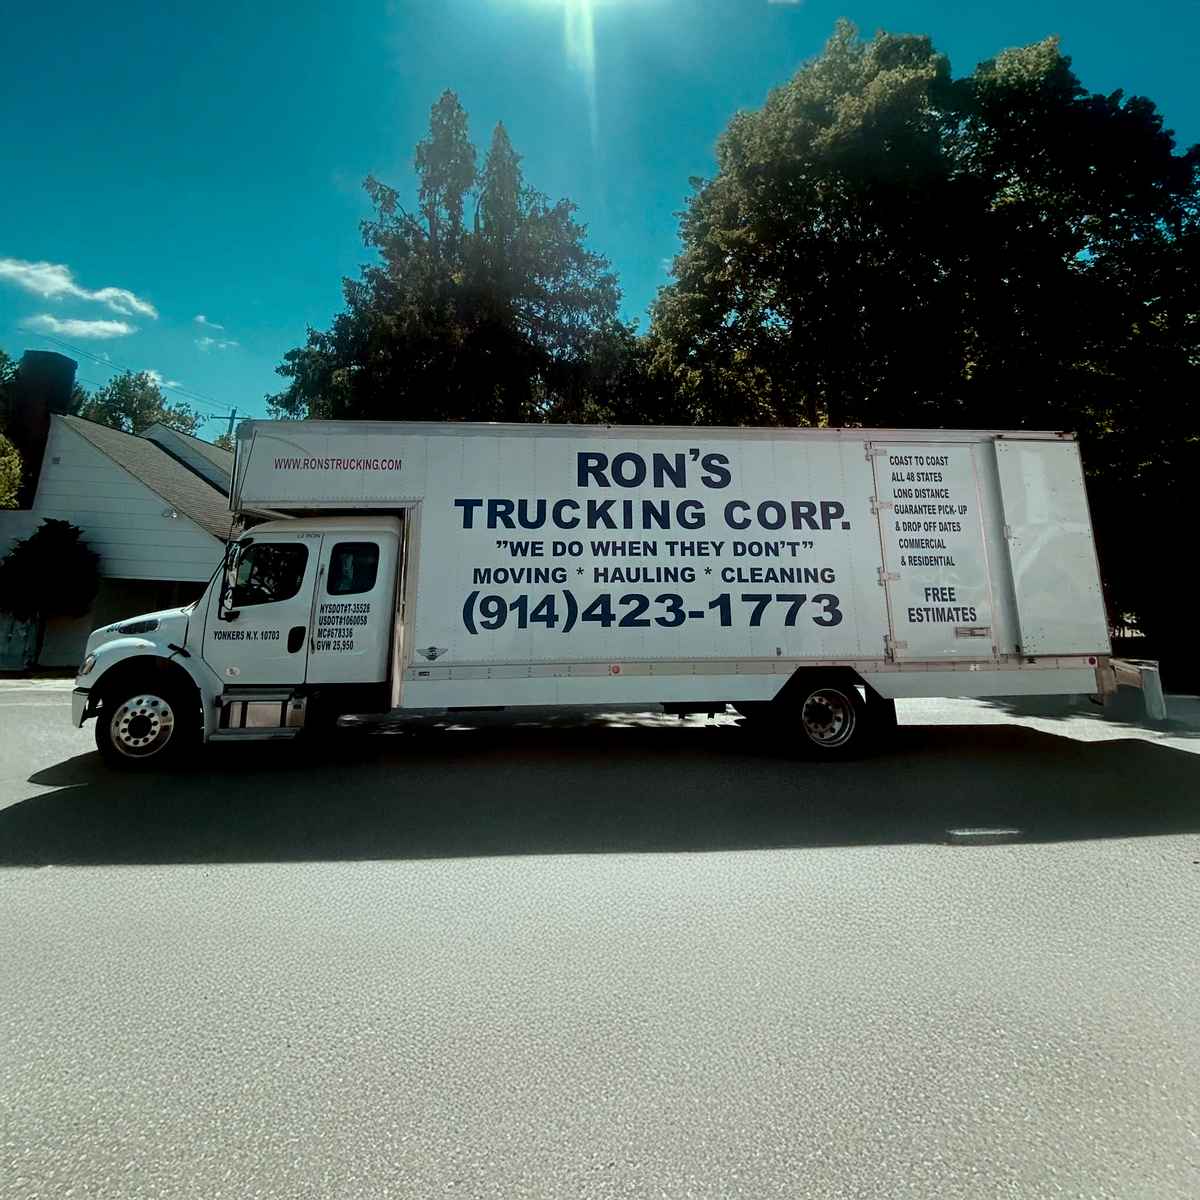
53 Torre Pl, Yonkers, NY 10703. Founded 23 years ago by ronald williams
Mon-Sat: 07:00-20:00
Fleet
5
trucks
Experience
23
years
Average Rate
0.0(0 reviews)
Be the first to share your experience!
All data is sourced from the Federal Motor Carrier Safety Administration (FMCSA).
Company Profile
Years in Business: 23 years•First Registered in Oct 2002
Company Information
Legal Name
ron's trucking corp
DOT Number
1060058
Registration Date
2002-08-10
Entity Type
C
Filing Information
Last Government Update
2025-24-02
Cargo Types
Company Officer
Company Officer
ronald williams
High-level performance indicators to quickly assess the company's scale and activity.
200,000
3
Total Drivers
0
CDL Drivers
5
Total Trucks
Detailed safety guidelines and procedures to ensure compliance and minimize risks.
14
Total Inspections
6
Clean Inspections
42.9%
Inspection Pass Rate
Safety Analysis
Ron's Moving, Packing, & Trucking Company operates a fleet of 5 trucks and 3 drivers, logging over 200,000 miles in 2024.
42.9%Poor
Clean Inspection Rate
14
Total Inspections
6
Passed Clean
8
With Notes
Recent Inspections
!
2025-05-26
TN
Minor notes
2024-09-17
NY
Clean
!
2023-07-25
NC
Minor notes
2022-11-29
NY
Clean
Data sourced from FMCSA government records
Post your job opening and connect with qualified candidates.
Verified
Fast matching
2,500+ companies
Business Name | Years Running | Owner's Name | DOT # | Trucks ↓ | Drivers | Miles/Year | Address |
|---|---|---|---|---|---|---|---|
51 | christian galan | 25982DOT Record | 38 | 22 | 300000 | 1133 tiffany street, bronx, ny 10459 | |
23 | eran sobol | 1058063DOT Record | 38 | 38 | 653 | 498 nepperhan avenue, yonkers, ny 10701 | |
28 | edmond dowling | 739428DOT Record | 12 | 12 | 50000 | 281 route 206 south, branchville, nj 7826 | |
8 | martin pollack | 3074688DOT Record | 7 | 10 | 90000 | 47 nepperhan ave suite 3, elmsford, ny 10523 | |
9 | shakeem williams | 2958935DOT Record | 5 | 4 | 100000 | 498 aka 530 nepperhan avenue, yonkers, ny 10701 | |
18 | andrew hayden | 1633639DOT Record | 5 | 3 | 20000 | 246 farragut ave, hastings-on-hudson, ny 10706 | |
23 | ronald williams | 1060058DOT Record | 5 | 3 | 200000 | 53 torre place, yonkers, ny 10703 | |
27 | michael zreik | 778539DOT Record | 4 | 4 | 250000 | 231 hawthorne ave, yonkers, ny 10705 |