Annual Miles (2024)
359,681
4250 N Marine Dr, Chicago, IL 60613. Founded 12 years ago by lyuda ksenych
DOT#2428328
Mon-Fri: 8:00-18:00
Sat-Mon: 9:00-15:00
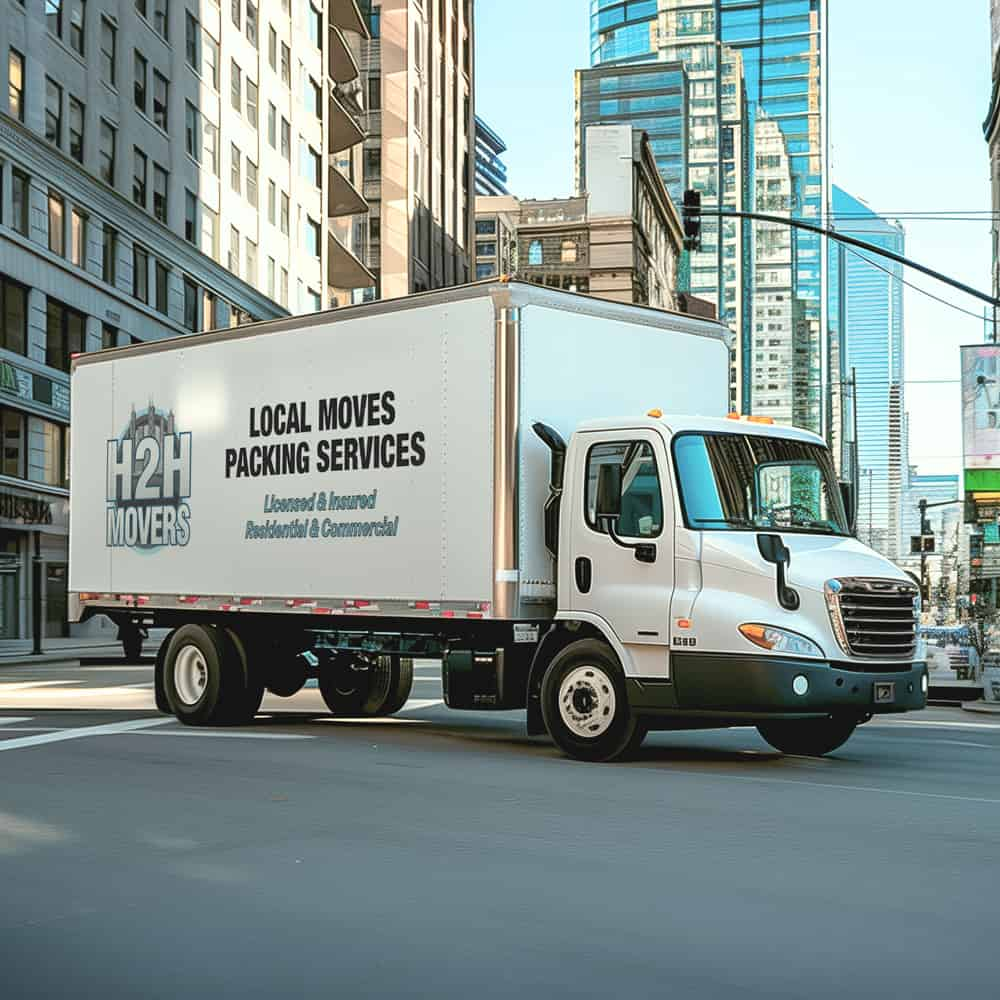
Fleet
6
trucks
Experience
12
years
H2H Movers stands out as one of Chicago's most trusted moving companies. They've built their stellar reputation by turning stressful relocations into smooth, worry-free experiences. With consistently high ratings across multiple review platforms, they've proven their dedication to customer satisfaction time and again. What sets H2H Movers apart in the competitive moving industry is their refreshing approach—quality always comes before quantity. Instead of rushing through jobs to fit more into their schedule, they give each client the time and attention they deserve. This customer-first philosophy shines through in their wide range of services, from complete packing and unpacking to specialized piano moving and furniture rearrangement. Over the years, H2H Movers has grown throughout Illinois. They now serve not only Chicago but also seven surrounding counties: Cook, Lake, McHenry, DuPage, Will, Kane, Kendall, and Kankakee. This expansion allows them to handle everything from moves within the same building to interstate relocations, all while maintaining their high standards. Their excellence hasn't gone unnoticed. H2H Movers has earned memberships in several respected Chicago organizations and received numerous industry awards that highlight their outstanding position in the moving sector. The company takes pride in its well-trained team. Each staff member learns not only the technical skills needed for safe handling but also develops the friendly attitude that has become a hallmark of the H2H brand. For anyone looking for affordable movers who never compromise on quality, H2H Movers continues to prove why they're Chicago's go-to choice for both home and business relocations.
Average Rate
0.0(0 reviews)
Be the first to share your experience!
All data is sourced from the Federal Motor Carrier Safety Administration (FMCSA).
Company Profile
Years in Business: 12 years•First Registered in Aug 2013
Company Information
Legal Name
h2h movers inc
DOT Number
2428328
Registration Date
2013-08-08
Entity Type
C
Filing Information
Last Government Update
2024-09-10
Cargo Types
Company Officer
Company Officer
lyuda ksenych
High-level performance indicators to quickly assess the company's scale and activity.
359,681
2
Total Drivers
1
CDL Drivers
6
Total Trucks
Detailed safety guidelines and procedures to ensure compliance and minimize risks.
30
Total Inspections
27
Clean Inspections
90.0%
Inspection Pass Rate
Safety Analysis
H2h Movers operates a fleet of 6 trucks and 2 drivers, logging over 359,681 miles in 2024.
90.0%Excellent
Clean Inspection Rate
30
Total Inspections
27
Passed Clean
3
With Notes
Recent Inspections
2025-09-26
IN
Clean
2025-07-28
IN
Clean
2025-05-21
NC
Clean
2024-10-09
IL
Clean
Data sourced from FMCSA government records
Post your job opening and connect with qualified candidates.
Verified
Fast matching
2,500+ companies
Business Name | Years Running | Owner's Name | DOT # | Trucks ↓ | Drivers | Miles/Year | Address |
|---|---|---|---|---|---|---|---|
52 | mark davison | 76235DOT Record | 1038 | 1944 | 33260561 | 101 east washington blvd suite 1100, fort wayne, in 46802 | |
national van lines inc | 52 | timothy helenthal | 76628 | 234 | 177 | 3898919 | 2800 roosevelt road, broadview, il 60155 |
41 | rachelle pascente | 258748DOT Record | 218 | 218 | 5026742 | 5875 n rogers avenue, chicago, il 60646 | |
carmichael leasing co inc | 25 | maximilian bechina | 934642 | 150 | 13 | 4798626 | 2200 s loomis st #1, chicago, il 60608 |
ohio rail connection inc | 21 | nabeel razick | 1285063 | 83 | 83 | 2000000 | 4900 s mason, chicago, il 60638 |
j & j trucking enterprise inc | 21 | john kurpiel | 1276545 | 82 | 76 | 7798359 | 5950 w 51st st, chicago, il 60638 |
new city moving llc | 3 | randall branscome | 4020807 | 78 | 56 | 3850 | 2929 n campbell ave, chicago, il 60618 |
special service co inc | 52 | 143437 | 54 | 56 | 0 | 681 n green st, chicago, il 60622-5966 |