Annual Miles (2020)
30,000
2010 Newcomb Ave, San Francisco, CA 94124. Founded 9 years ago by kirk william maurer
Mon-Fri: 09:00-18:00
Sat: 10:00-18:00
Fleet
3
trucks
Experience
9
years
Average Rate
0.0(0 reviews)
Be the first to share your experience!
All data is sourced from the Federal Motor Carrier Safety Administration (FMCSA).
Company Profile
Years in Business: 9 years•First Registered in Feb 2017
Company Information
Legal Name
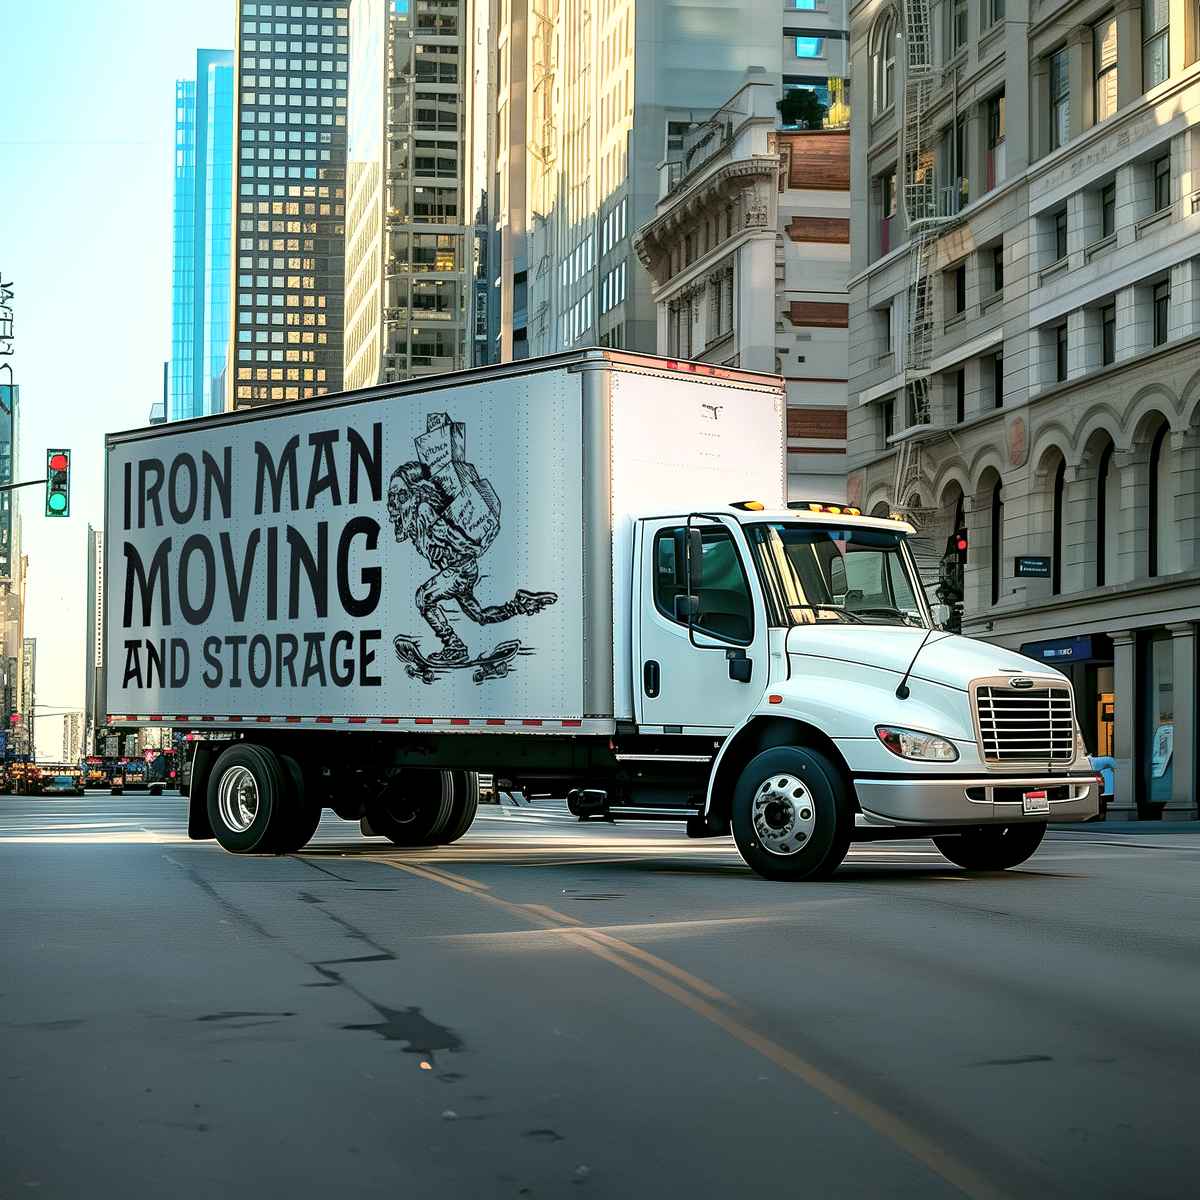
iron man moving incorporated
DBA Name
iron man moving
DOT Number
2976453
Registration Date
2017-18-02
Entity Type
C
Filing Information
Last Government Update
2021-30-03
Cargo Types
Company Officer
Company Officer
kirk william maurer
High-level performance indicators to quickly assess the company's scale and activity.
30,000
6
Total Drivers
1
CDL Drivers
3
Total Trucks
Detailed safety guidelines and procedures to ensure compliance and minimize risks.
5
Total Inspections
4
Clean Inspections
80.0%
Inspection Pass Rate
Safety Analysis
Iron Man Moving operates a fleet of 3 trucks and 6 drivers, logging over 30,000 miles in 2020.
80.0%Good
Clean Inspection Rate
5
Total Inspections
4
Passed Clean
1
With Notes
Recent Inspections
!
2021-03-24
AZ
Minor notes
2020-03-24
CA
Clean
2019-08-24
CA
Clean
2019-05-22
NM
Clean
Data sourced from FMCSA government records
Post your job opening and connect with qualified candidates.
Verified
Fast matching
2,500+ companies
Business Name | Years Running | Owner's Name | DOT # | Trucks ↓ | Drivers | Miles/Year | Address |
|---|---|---|---|---|---|---|---|
36 | laurence o'toole | 373544DOT Record | 88 | 253 | 5000000 | 7 mckay ave, winchester, ma 1890 | |
specialty towing and recovery inc | 11 | mario villatoro | 2741142 | 34 | 26 | 250000 | 2045 oakdale ave, san francisco, ca 94124 |
goodwill industries of sf san mateo and marin co | 11 | jesse edwards | 2662281 | 25 | 23 | 166142 | 1500 mission st, san francisco, ca 94103 |
move loot inc | 11 | william bobbitt | 2599767 | 25 | 45 | 20000 | 1067 market st suite 2001, san francisco, ca 94103 |
7 | mikhail shcherbakov | 3175734DOT Record | 20 | 15 | 40000 | 5020 college view ave, los angeles, ca 90041 | |
delancey street foundation | 39 | stephanie muller | 289919 | 13 | 15 | 60000 | 5700 3rd street, san francisco, ca 94124 |
patrick j mcgee | 11 | kathleen t mcgee | 2728519 | 10 | 1 | 0 | 275 moncada way, san francisco, ca 941272705 |
one big man & one big truck moving company | 3 | wolfgang matt | 3979323 | 9 | 13 | 90000 | 696 amador st fl 1, san francisco, ca 94124-1241 |