Annual Miles (2023)
323,564
3935 Perimeter West Dr, Charlotte, NC 28214. Founded 6 years ago by anatoly ostapenko
Mon-Fri: 7:00-18:00
Sat: 8:00-15:00
Fleet
13
trucks
Experience
6
years
Average Rate
0.0(0 reviews)
Be the first to share your experience!
All data is sourced from the Federal Motor Carrier Safety Administration (FMCSA).
Company Profile
Years in Business: 6 years•First Registered in Sep 2019
Company Information
Legal Name
united pro movers llc
DBA Name
best american movers
DOT Number
3332133
Registration Date
2019-09-09
Entity Type
C
Filing Information
Last Government Update
2024-10-04
Cargo Types
Company Officer
Company Officer
anatoly ostapenko
High-level performance indicators to quickly assess the company's scale and activity.
323,564
12
Total Drivers
0
CDL Drivers
13
Total Trucks
Detailed safety guidelines and procedures to ensure compliance and minimize risks.
40
Total Inspections
24
Clean Inspections
60.0%
Inspection Pass Rate
Safety Analysis
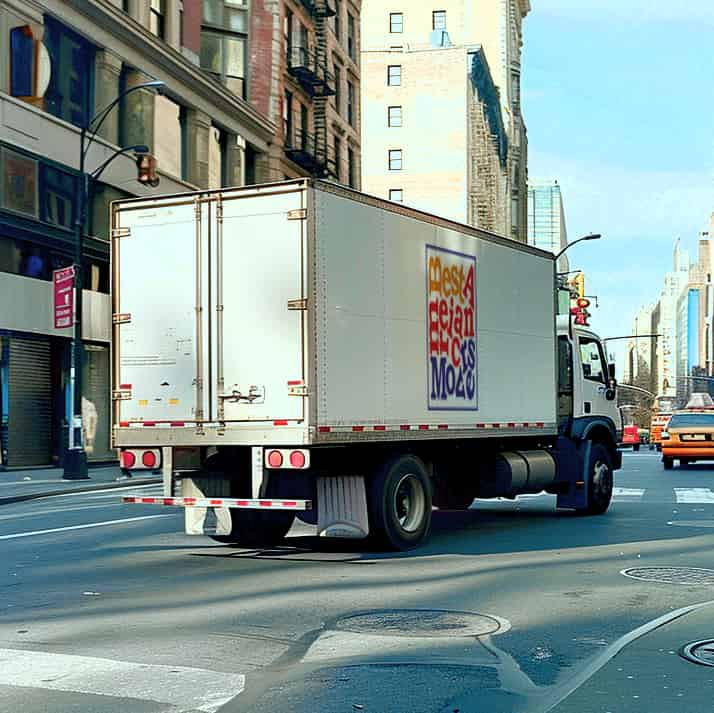
Best American Movers operates a fleet of 13 trucks and 12 drivers, logging over 323,564 miles in 2023.
60.0%Below Average
Clean Inspection Rate
40
Total Inspections
24
Passed Clean
16
With Notes
Recent Inspections
2024-09-03
MD
Clean
2024-07-30
TN
Clean
2024-02-11
NC
Clean
!
2023-12-09
WI
Minor notes
Data sourced from FMCSA government records
Post your job opening and connect with qualified candidates.
Verified
Fast matching
2,500+ companies
Business Name | Years Running | Owner's Name | DOT # | Trucks ↓ | Drivers | Miles/Year | Address |
|---|---|---|---|---|---|---|---|
52 | robert f. mccabe | 77949DOT Record | 3802 | 3691 | 85291458 | 1 premier drive, fenton, mo 63026 | |
52 | james k. mcmurray | 125550DOT Record | 3243 | 1486 | 49439997 | 1212 st george road, evansville, in 47711 | |
apex transit llc | 13 | stanislav ivanov | 2348288 | 90 | 96 | 7759851 | 3301 rotary drive, charlotte, nc 28269 |
36 | laurence o'toole | 373544DOT Record | 88 | 253 | 5000000 | 7 mckay ave, winchester, ma 1890 | |
freshpoint north carolina inc | 17 | rod bauer | 1795137 | 80 | 68 | 2067380 | 2121-a-distribution center drive, charlotte, nc 28269 |
clt express llc | 12 | sevilya shaybova | 2449060 | 43 | 49 | 4120000 | 8418 mount holly road, charlotte, nc 28214 |
7 | semen mayzlin | 3182355DOT Record | 37 | 36 | 1887000 | 6000 fairview road suite 1200, charlotte, nc 28210 | |
public moving services llc | 9 | alexei pistun | 2955650 | 27 | 36 | 95256 | 7706 waterford square dr unit 1221, charlotte, nc 28226 |