Annual Miles (2024)
318,687
6901 Northpark Blvd Ste B, Charlotte, NC 28216. Founded 27 years ago by chris generale
Mon-Thu: 07:00-21:00
Fri: 07:00-20:00
Sat: 08:00-17:00
Sun: 09:00-19:00
Fleet
12
trucks
Experience
27
years
Average Rate
0.0(0 reviews)
Be the first to share your experience!
All data is sourced from the Federal Motor Carrier Safety Administration (FMCSA).
Company Profile
Years in Business: 27 years•First Registered in Apr 1999
Company Information
Legal Name
bournias llc
DBA Name
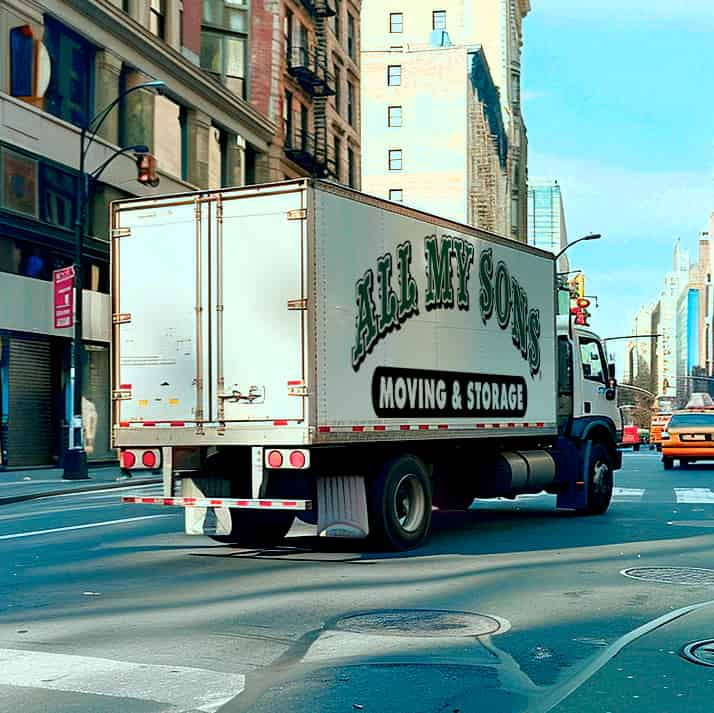
all my sons moving and storage
DOT Number
806764
Registration Date
1999-20-04
Entity Type
C
Filing Information
Last Government Update
2025-08-04
Cargo Types
Company Officer
Company Officer
chris generale
High-level performance indicators to quickly assess the company's scale and activity.
318,687
16
Total Drivers
0
CDL Drivers
12
Total Trucks
Detailed safety guidelines and procedures to ensure compliance and minimize risks.
8
Total Inspections
6
Clean Inspections
75.0%
Inspection Pass Rate
Safety Analysis
All My Sons Moving & Storage operates a fleet of 12 trucks and 16 drivers, logging over 318,687 miles in 2024.
75.0%Average
Clean Inspection Rate
8
Total Inspections
6
Passed Clean
2
With Notes
Recent Inspections
2025-02-08
NC
Clean
!
2024-08-15
VA
Minor notes
2023-06-28
NC
Clean
2023-06-26
MD
Clean
Data sourced from FMCSA government records
Post your job opening and connect with qualified candidates.
Verified
Fast matching
2,500+ companies
Business Name | Years Running | Owner's Name | DOT # | Trucks ↓ | Drivers | Miles/Year | Address |
|---|---|---|---|---|---|---|---|
52 | robert f. mccabe | 77949DOT Record | 3802 | 3691 | 85291458 | 1 premier drive, fenton, mo 63026 | |
52 | james k. mcmurray | 125550DOT Record | 3243 | 1486 | 49439997 | 1212 st george road, evansville, in 47711 | |
apex transit llc | 13 | stanislav ivanov | 2348288 | 90 | 96 | 7759851 | 3301 rotary drive, charlotte, nc 28269 |
36 | laurence o'toole | 373544DOT Record | 88 | 253 | 5000000 | 7 mckay ave, winchester, ma 1890 | |
freshpoint north carolina inc | 18 | rod bauer | 1795137 | 80 | 68 | 2067380 | 2121-a-distribution center drive, charlotte, nc 28269 |
clt express llc | 12 | sevilya shaybova | 2449060 | 43 | 49 | 4120000 | 8418 mount holly road, charlotte, nc 28214 |
7 | semen mayzlin | 3182355DOT Record | 37 | 36 | 1887000 | 6000 fairview road suite 1200, charlotte, nc 28210 | |
public moving services llc | 9 | alexei pistun | 2955650 | 27 | 36 | 95256 | 7706 waterford square dr unit 1221, charlotte, nc 28226 |