Annual Miles (2024)
300,000
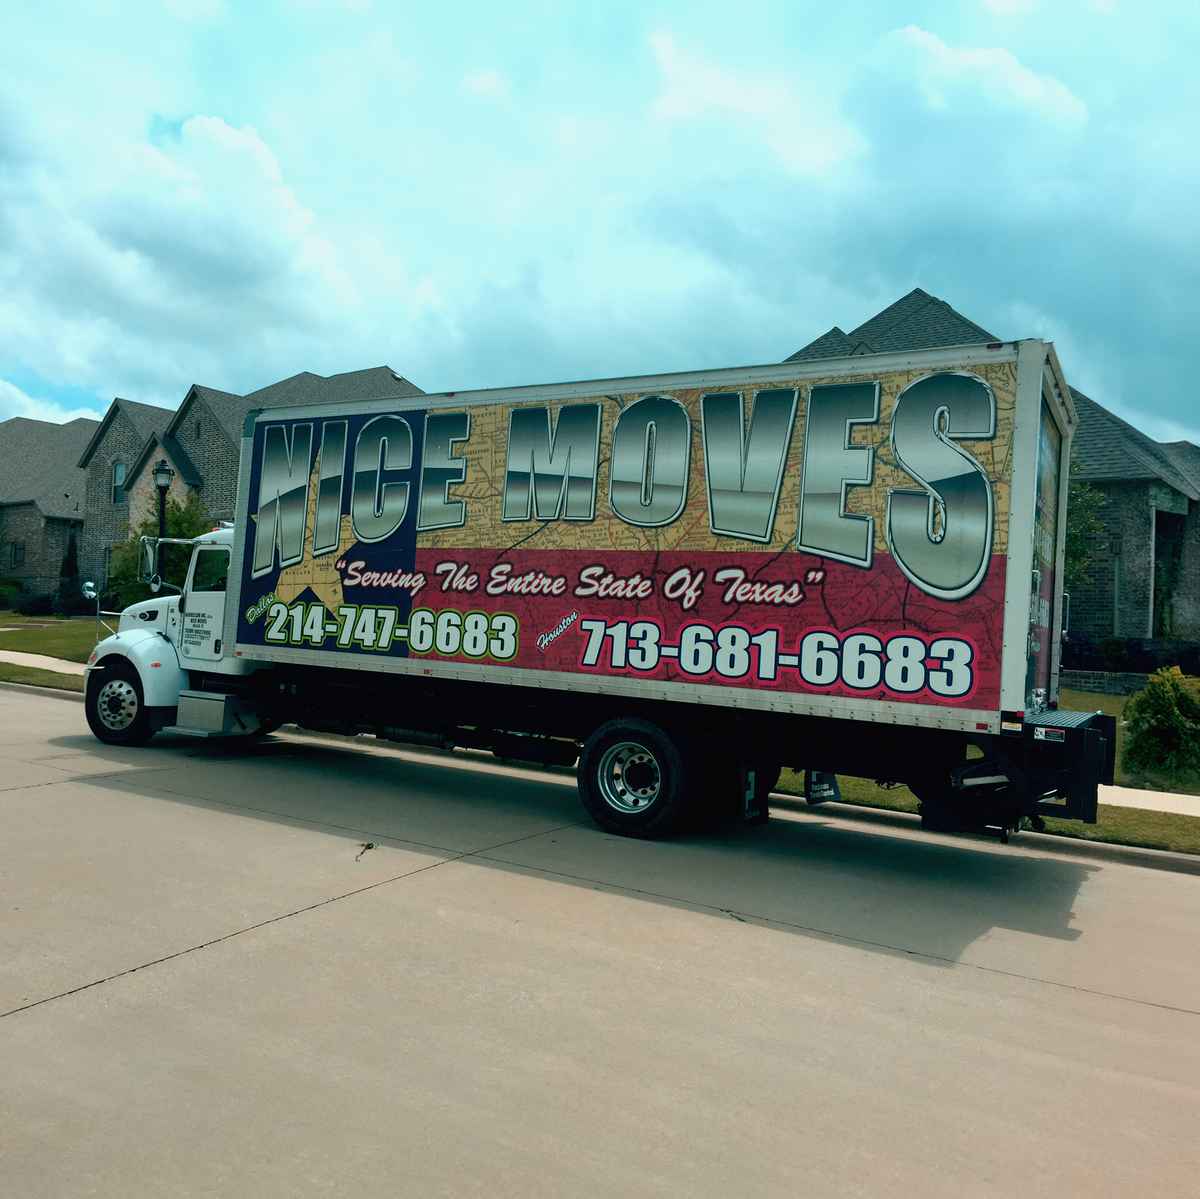
1266 Profit Dr, Dallas, TX 75247. Founded 18 years ago by martin louis harrelson
DOT#1769117
Mon-Fri: 09:00-12:00, 13:00-16:00
Fleet
16
trucks
Experience
18
years
Average Rate
0.0(0 reviews)
Be the first to share your experience!
All data is sourced from the Federal Motor Carrier Safety Administration (FMCSA).
Company Profile
Years in Business: 18 years•First Registered in May 2008
Company Information
Legal Name
harrelson inc
DBA Name
nice moves
DOT Number
1769117
Registration Date
2008-06-05
Entity Type
C
Filing Information
Last Government Update
2026-03-03
Cargo Types
Company Officer
Company Officer
martin louis harrelson
High-level performance indicators to quickly assess the company's scale and activity.
300,000
12
Total Drivers
0
CDL Drivers
16
Total Trucks
Detailed safety guidelines and procedures to ensure compliance and minimize risks.
12
Total Inspections
6
Clean Inspections
50.0%
Inspection Pass Rate
Safety Analysis
Nice Moves operates a fleet of 16 trucks and 12 drivers, logging over 300,000 miles in 2024.
50.0%Poor
Clean Inspection Rate
12
Total Inspections
6
Passed Clean
6
With Notes
Recent Inspections
2024-06-05
TX
Clean
!
2023-11-21
OK
Minor notes
2022-09-05
NM
Clean
2022-09-05
NM
Clean
Data sourced from FMCSA government records
Post your job opening and connect with qualified candidates.
Verified
Fast matching
2,500+ companies
Business Name | Years Running | Owner's Name | DOT # | Trucks ↓ | Drivers | Miles/Year | Address |
|---|---|---|---|---|---|---|---|
nicks transports | 7 | luis elias zaragoza jr. | 3313326 | 599994 | 4 | 0 | 4719 la rue st, dallas, tx 75211-7906 |
52 | james k. mcmurray | 125550DOT Record | 3243 | 1486 | 49439997 | 1212 st george road, evansville, in 47711 | |
brothers produce of dallas inc | 14 | james bos | 2316812 | 159 | 165 | 7307000 | 2600 mccree road suite 90, dallas, tx 75041 |
17 | jacky noons | 1914113DOT Record | 115 | 115 | 600000 | 6805 sands point dr, houston, tx 77074 | |
nroute transportation services llc | 3 | andrea necole breedlove | 4079976 | 72 | 12 | 0 | 5429 singing hills dr, dallas, tx 75241-1236 |
dfw hot shot inc | 19 | raymundo prieto | 1658695 | 72 | 70 | 4600000 | 2501 weir st, dallas, tx 75212 |
k4 portage express llc | 1 | keyanna hicks | 4304065 | 61 | 4 | 0 | 8613 old hickory trl apt 3201, dallas, tx 75237 |
weirs furniture village inc | 16 | jay a comstock | 1941549 | 41 | 37 | 640000 | 3219 knox street, dallas, tx 75205-0431 |